Notes For All Chapters – Maths Class 6 Ganita Prakash
Data Handling and Presentation
What is Data?
- Data is a collection of facts, numbers, measurements, or observations that provide information about something.
- Examples: A list of favorite colors in a class or the weight of students.
Collecting and Organizing Data
- You can gather data by asking people questions (e.g., asking classmates about their favorite game).
- Once data is collected, it needs to be organized for easy understanding, often in tables or lists.
Tally Marks
- A simple way to record and organize data.
- For every group of five, use four vertical lines and a diagonal line through them.
Pictographs
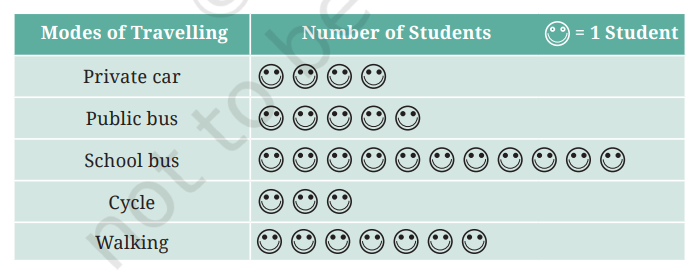
- A visual way to represent data using symbols or pictures.
- Each symbol in a pictograph can represent one or more units of the data.
- Example: One symbol of a bus can represent 5 students who use the bus for transport.
Bar Graphs
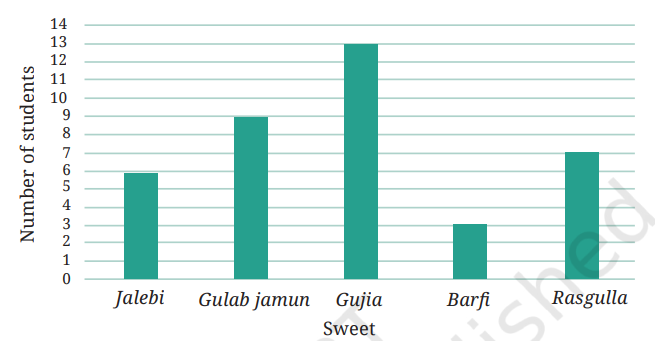
- A type of graph that uses rectangular bars to represent data.
- The length or height of each bar shows the frequency or amount of data.
- Bars can be drawn vertically or horizontally, with equal gaps between them.
Choosing the Right Scale
- In graphs, choosing a scale (e.g., 1 unit = 10 students) is important for accuracy and clarity.
Arranging Data in Ascending Order
- Helps in identifying patterns, such as the smallest or largest values easily.
Frequency Distribution Table
- A table that shows how often each value occurs.
- Useful for summarizing large amounts of data.
Bar Graph Construction
- Steps to make a bar graph:
- Draw two lines (horizontal and vertical).
- Label one axis with categories (e.g., games, sweets) and the other with frequencies (e.g., number of students).
- Choose a scale and draw bars accordingly.


One of the best for any one as it is full of cheering
infographic definition