Notes For All Chapters Geography Class 9 CBSE
People ate the nation’s most valuable resource. A well-educated, healthy population provides potential power to the nation. The people are important to develop the economy and society, they make resources and use them. The people are themselves a resource with varying qualities.
A census is an official enumeration (numbering) of population done periodically. The first census in India (partial) was done in 1872. While, the first complete census was done in 1881. It is done every 10 years. The recent census was done in 2011. The census of India provides information regaling the population.
The three aspects concerned about population are as follows
- Size and distribution of population It refers to the total number of people in the country and where they are located.
- Population growth and process of population change It refers to how the population has grown and changes in its composition.
- Characteristics of qualifies of life population It refers to age, sex-ratio, literacy levels, occupational structure, health conditions of people.
Population Size And Distribution
Hie arrangement or a spread of people of a country in different places, is Catted population distribution.
Size of population and its distribution can be studied under two heads- one population size and distribution by numbers and other in population distribution by density.
India’s Population Size and Distribution by Numbers
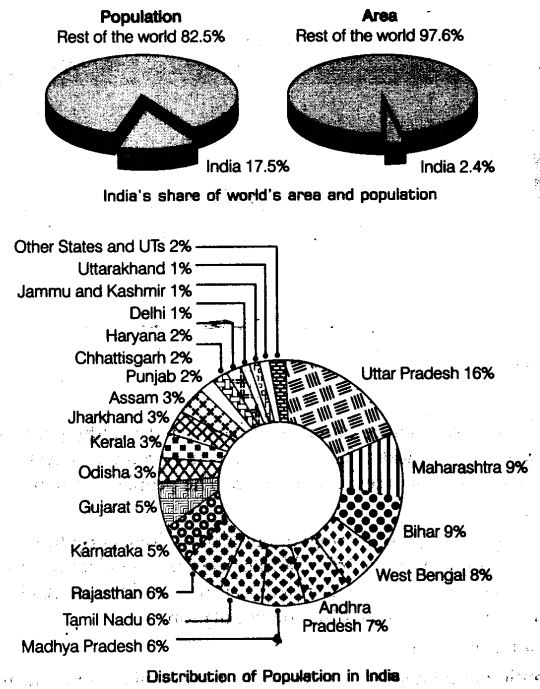
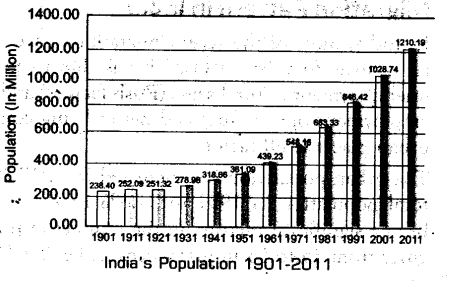
As per 2011 Census, population of India stood at 1,210 million, which is 17.5% of the total world population.. It is unevenly distributed over the various states, with Uttar Pradesh having the highest population (199 million accounts for about 16.49 per cent of the countries population) and Sikkim the lowest population (0.6 million accounts for about 0.05 per cent of the country’s population). Among Union Territories, Delhi has the highest (16.75 million) and Lakshadweep the lowest (64,429) population.
Almost half of India’s population lives in just five states cpmpfisiog Uttar Pradesh, Maharashtra, Bihar, West Bengal and Andhra. Pradesh, while Rajasthan being largest state accounted for only 6% of the total population.
India’s Population Distribution by Density
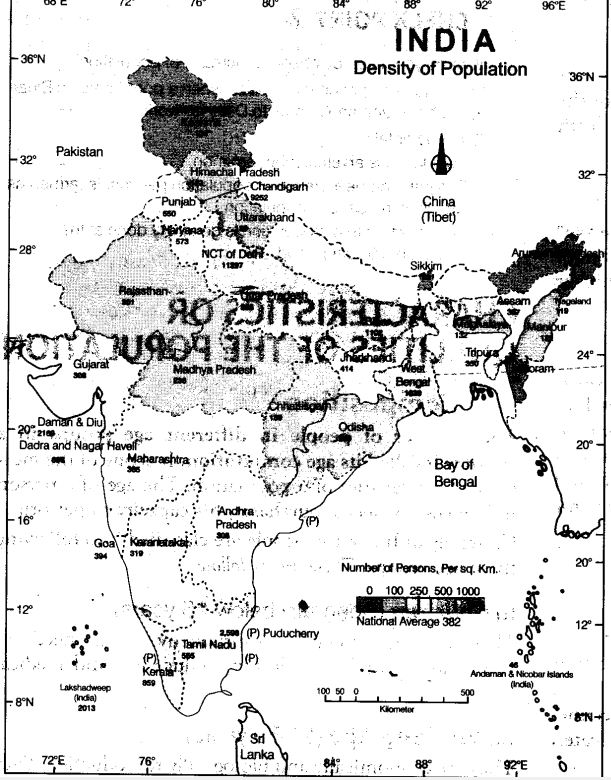
The uneven population distribution can be better judged by the population density in the various states. The number of people living per unit area (sq. km) in an area (state or country) is called population! density of that area.
India is one of the most destiny populated countries in the world. After Bangladesh and Japan, it is the third most densely populated country.
India’s population density in 2001 was 324 persons per sq km (this increased to 382 persons per sq km in the 2011 Census), with West Bengal having the highest density of 904 persons per sq km and Arunachal Pradesh the lowest With only 13 persons per sq. km.
According to 2011 Census, Bihar has the highest population density 1,102 persons per sq km and Arunachal Pradesh having the lowest population density of 17 persons per sq km.
On the basis of population density inhale country is divided in to three regions
High population density states These states are characterised by flat plains with fertile soils and abundant rainfall, e.g. states of Northern Plains and Kerala.
Moderate population density states These states are characterised by hilly and rocky nature of terrain, moderate to low rainfall, shallow and less fertile soil. e.g. Assam and most of the peninsular states.
Low population density states States with – low population density below 250 person per sq. km are characterised by rugged terrain (mountainous and desert) and unfavourable climatic condition, e.g. Arunachal Pradesh, Sikkim and Jammu and Kashmir etc.
[Note: Jelangema became the 29th state of India on the 2nd June 2014 after the reorganisation of the type of Andhra Pradesh.]
Population Growth And Processes Of Population Change
Due to births, deaths and migrations the number, distribution and composition of population change continuously.
Population Growth
The change in the number of people of a country or state during a specific period of time is called growth of population. Usually, it is mostly calculated at the interval of 10 years. The change can be expressed either in terms of absolute numbers or in terms of annual growth rate.
Absolute Increase of Population It means the absolute numbers added each year or in each decade in the population. It is obtained by simply subtracting the earlier population (e.g. that of 1991) from the later population (e.g. that of 2001).
Annual Growth Rate of Population The rate at which the number of individuals in a population increase in 1 year as a fraction of the initial population; is called annual growth rate of population. It is expressed in terms of per cent per annum. For example, a rate of increase of 2% per annum means that there was an increase of 2 persons for every 100 persons in the initial population.
Population Growth Rate Since Independence
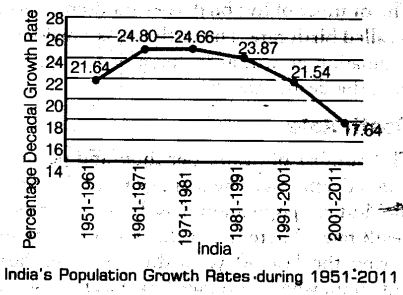
India’s annual growth rate of population increased steadily till 1981. Since then, the annual rate of population growth started declining. Still the population growth of India in 1990s was 182 million (in terms of number). This addition of people was larger than ever before. Inspite of decreasing annual growth rate (in percent), the largest addition in people(in terms of number) is due to the large population of the country.
A low growth rate results a large absolute increase due to very high population. However, the declining growth rate is a positive indicator for the efforts of birth control but the total additions to the population continue to grow. If this rate of increase continues, then India will surpass China by 2045 to become the most populous country in the world.
Processes of Population Change/Growth
Population changes due to the processes of births, deaths and migrations. The natural increase of population or the growth rate is the difference between birth rates and death rates.
Birth Rate
The number of live births per thousand persons in a year is called birth rate. The birth rate is a major component of population growth as in India, it has been always higher than the death rate.
Death Rate
The number of deaths per thousand persons in a year is called death rate. The main cause of the rate of growth of the Indian population has been the rapid decline in death rates. There has been a rapid decline in death rates during the last 50 years due to better healthcare and nutrition, which have made this factor also important for growth of population.
The trend of Population Growth Due to Birth Rate and Death Rate
High birth rates and declining death rates were the phenomena till 1980, which resulted date of birth population growth. After that due to government efforts and increased awareness, the birth fate also started to decline, resulting in gradual decline in the population growth rate.
Migration
It is the movement of people across regions and territories. The movement of people within the country (from one place to another) is called internal migration. It does not change the population size but it changes the population distribution of an area.
The movement of people from one country to other is called international migration. It changes population size of the country as well as population distribution.
Migration Pattern in India
In India, most of the recent migrations have been from rural areas to urban areas. This is due to poverty and unemployment in rural areas (Push factors) and increased employment opportunity and better living, conditions in urban places (Pull factors).
The urban population has increased from 17.29% of the total population in 1951 to 31.8% in 2011. There has been a significant increase in the number of million plus cities from 35 to 53 in just a decade, i.e. 2001 to 2011.
Characteristics Or Qualities Of The Population
Age Composition
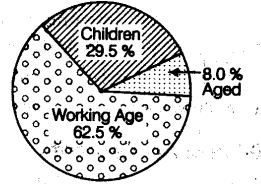
The number of people in different age groups in a country is called its age composition. It is one of the most basic characteristics of a population. The age of a person influences his needs, purchases, his capacity to perform. Generally, in India, people are classified into the following three age groups. These are as follow
(i) Children (Generally below 15 years)
They are economically unproductive and need to be provided with food, clothing, education and medical care.
(ii) Working Age (15-59 years)
They are economically and biologically reproductive. They comprise the working population.
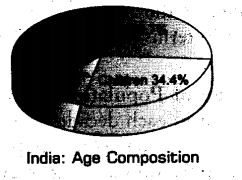
The working age group is an economically productive group. In 2001, this group comprised 58.7% of the population, while children made up 34.4 % and the aged only 6.9%.
(iii) Aged (Above 59 years)
They can be economically productive though they may have retired. They may be working voluntarily but they are not available for employment through recruitment.
Dependent Population
The population of children and aged people together constitute the dependent population. They are termed dependent because they are not producers.
Sex Ratio
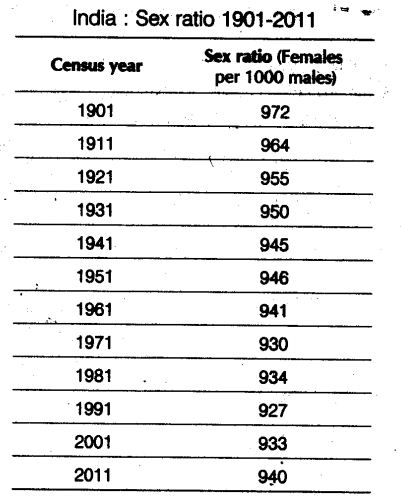
The sex ratio is the number of females per 1000 males in the population. It is an important social indicator to measure the extent of equality between males and females in a society at a given time. In India, the sex ratio has always been unfavourable to females due to reasons of tradition and unscrupulous actions of people. Certain states which are progressive like Kerala, have a very favourable sex ratio. As per census 2011, the sex ratio of Kerala is 1084 compared to 940 for all of India. Puducherry has 1038 females for every 1000 males, while Delhi has only 866 females p*r thousand males and Haryana has just 877 females per thousand.
Literacy Rate
A person who can read and write any language with understanding by the age of 7 years is considered literate.
The total percentage of the population of an area at a particular time aged seven years or above who can read and write with understanding is called literacy rate.
Although there has been a regular increase in literacy rates in the country, rural literacy lags behind urban literacy significantly and female literacy lags behind male literacy by a huge margin.
According to Census 2011 literacy rate in the country is 74.04%. It has revealed that urban literacy rate was 84.98 %, while that in the rural areas was only 68.91 %. Similarly, female literacy was only 65.46 %, while that for males was 82.14 %.
Occupational Structure
Occupational structure referred to as the distribution’^ population according to various types of occupation. Economically active population percentage is an important index of development. There is a large variety of occupation in the country. The occupations are usually categorised into primary, secondary and tertiary occupations.
Primary occupations are those in which natural resources are extracted from the Earth. These include agriculture, fishery, forestry, mining, quarrying, etc.
Secondary occupations are those in which the extracted natural resources are processed into products for use. These include manufacturing, refining, construction, etc.
Tertiary occupations are those which support the primary and secondary occupations by providing services. This transportation, communications, commerce, administration, legal services, etc.
The pattern of the Working Population
The proportion of people working in different activities vary in developed and developing countries. The developing countries have more of their population working in primary occupations, whereas the developed nations have more of their population working in secondary and tertiary occupations.
In India, half of the population is engaged in agriculture alone. However, due to industrialisation and urbanisation in recent times, there has occurred a significant shift towards secondary and tertiary occupations which earlier stood about 13% and 20%, respectively.
Health
Health is an important component of population composition. It affects its development significantly. Due to the sustained efforts of government, healthcare programmes, life expectancy at birth has improved from 36.7 years in 1951 to 64.7 years in 2011.
The death rate has declined from 25 per 1000 persons in 1951 to 7.2 in 2011. However, healthcare and nutrition are still major issues. Malnutrition in children afflicts a large percentage of the population.
Availability of safe drinking -water and proper sanitation are major problems in rural areas and need urgent action. Only one-third of the rural population has these basic amenities. The level of nutrition and per capital calorie consumption is much below the recommended level. This can be reduced by appropriate policy on population.
Adolescent Population
Adolescents are population aged from 10 to 19 years. They currently comprise about 20% of India’s population and are an important future resource for the country.
Their nutritional requirements are more than that of either adults or younger children, but it our country the diet available for them is usually inadequate for their requirements, which leads to deficiency and stunted growth. Many adolescent girls suffer from anaemia and they must be made aware of their requirements through better education and literacy they confront.
National Population Policy
After recognising that the family planning would improve individual health and welfare, the Government of India initiated its first Family Planning Programme in 1952. This, promoted responsible and planned parenthood on a voluntary basis. In the year 2000, the government formulated the National Population Policy (NPP 2000), which had the following major objectives
- Providing a policy framework for imparting free and compulsory school education up to 14 years of age.
- Reducing infant mortality rate to below 30 per 1000 live births.
- Achieving universal immunisation of children against all vaccine-preventable diseases.
- Promoting delayed marriage for girls.
- Making family welfare a people-centred programme.
NPP 2000 and Adolescents
National Population Policy (NPP) 2000 identified adolescents as one of the major sections of the population that need greater attention.
NPP 2000 put greater emphasis on the important needs of adolescents including protection from unwanted pregnancies,’ Sexually Transmitted Diseases (STDs) and risks of unprotected sex. It focussed on programmes that aim towards encouraging delayed marriage and childbearing, education of adolescents, providing food supplements and nutritional services, etc.
Summary
Human beings are important resources who not only utilise resources and but also create social and cultural environment.
‘Resources’, ‘calamities’ and disasters’ becomes meaningful when taken in relation to a human being.
The number, distribution, growth and characteristics of human beings provide basic background for understanding and appreciating various aspects of the environment.
The census is official information about the population of a country done at regular interval (mostly 10 year period).
India has huge population of over a billion, and the population is distributed unevenly throughout the country.
The uneven distribution of population can be known by calculating population density of an area, which is the number of people per unit area.
More than half of India’s population resides in five states of Uttar Pradesh, Maharashtra, Bihar, West Bengal and Andhra Pradesh.
India has the third highest population density in the world, which is just after Bangladesh and Japan.
Rugged terrain and unfavourable4climatic condition are reason for sparse population in some regions such as Arunachal Pradesh.
Assam and most of peninsular India has moderate population density.
The high population density in India is found in the Northern Plain and Kerala.
The flat plain area with fertile soils and abundant rainfall are major factors contributing to high population density.
The change in the number of inhabitants of a country at a particular period of time is called growth of population.
Growth of the population is affected by births, deaths, and migration.
The increase in the population calculated by subtracting the earlier population from the later is known as absolute increase in population.
The rate of increase of population per year is measured in terms of per cent per annum and known as the annual growth rate of population.
Although, India’s population is steadily increasing from 1951, but since 1981, the rate of growth has started to decline gradually.
The difference between birth rate and death rate gives a natural increase in population.
The number of live birth per thousand persons per year is termed as birth rate.
The number of deaths per thousand of persons per year is termed as death rate.
Migration is the third component of population growth which represent the movement of people from one place to another.
When the movement of people occurs within a country it constitutes internal migration but when the movement is between the country it constitutes external or International migration.
Most migration in India takes place from rural areas to urban areas due to push and pull factors.
Adverse condition, poverty, unemployment in rural areas are push factor of migration.
Greater employment opportunities, better living conditioks in the cities are pull factor of migration.
The age composition of population of nation is grouped into 3 categories : Children (0-14 years) Adult (15-59 years) and aged (60 – above).
Dependency ratio is the ratio of people of dependent age (Below 15 and above 60 years) to people of economically active ages (15-59 years).
The number of females per 1000 males in the population is called sex ratio and is an important social indicator to measure the extent of equality between males and females.
State of Kerala and Union Territory of Puducherry has favourable sex ratio where as Delhi and Haryana has very adverse sex ratio.
A person of 7 years or above who can read and write and understand any one language is termed as literate.
Agriculture, animal husbandry, forestry, fishing mining and quarrying are primary occupation.
The manufacturing industry, building and construction work etc. constitute secondary occupation.
Transport, communication, commerce, administration and other services are tertiary occupations.
Adolescents constitute one-fifth of the total population of India and adequate attention has to be paid on their nutrition requirements.
Comprehensive family Planning Programme in India was started in 1952 and the National Population Policy (NPP) 2000 is a part of it.
NPP aims to impart free and compulsory education up to 14 years, reduce the infant mortality rate, deal with adolescent-specific problems etc.
Leave a Reply