Notes For All Chapters Accountancy Class 12 CBSE
Topic 1: Introduction
1. Ratio It is an arithmetical expression of relationship between two related or interdependent items.
2. Accounting Ratios It is a mathematical expression that shows the relationship between various items or groups of items shown in financial statements. When ratios are calculated on the basis of accounting information, they are called accounting ratios.
3. Ratio Analysis It is a technique which involves re-grouping of data by application of arithmetical relationship.
4. Objectives of Ratio Analysis
(i) To know the areas of an enterprise which need more attention.
(ii) To know about the potential areas which can be improved on.
(iii) Helpful in comparative analysis of the performance.
(iv) Helpful in budgeting and forecasting.
(v) To provide analysis of the liquidity, solvency, activity and profitability of an enterprise.
(vi) To provide information useful for making estimates and preparing the plans for future.
5. Advantages of Ratio Analysis
(i) It is useful in analysis of financial statements.
(ii) Helps in simplifying accounting figures.
(iii) Useful in judging the operating efficiency of business.
(iv) Helps in identification of problem areas.
(v) Helpful in comparative analysis.
6. Limitations of Ratio Analysis
(i) Accounting ratios ignore qualitative factors.
(ii) Absence of universally accepted terminology.
(iii) Ratios are affected by window-dressing.
(iv) Effects of inherent limitations of accounting.
(v) Misleading results in the absence of absolute data.
(vi) Price level changes ignored.
(vii) Affected by personal bias and ability of the analyst.
Topic 2: Classification of Accounting Ratios
Classification of Accounting Ratios
In view of the requirements of various users, the accounting ratios may be classified as under
1. Liquidity Ratios Liquidity ratios measure the firm’s ability to fulfil its short-term financial obligations.
(i) Current ratio/Working capital ratio This ratio establishes relationship between current assets and current liabilities and is used to assess the short-term financial position of the business concern. Current ratio of 2:1 is considered to be ideal.
Items Included in Current Assets
(a) Current investments
(b) Inventories (Excluding loose tools, stores and spares)
(c) Trade receivables (bills receivable and sundry debtors less provision for doubtful debts)
(d) Cash and cash equivalents (cash in hand, cash at bank, cheques/drafts in hand)
(e) Short-term loans and advances
(f) Other current assets (prepaid expenses, interest receivable, etc.)
Items Included in Current Liabilities
(a) Short-term borrowings
(b) Trade payables (bills payable and sundry creditors)
(c) Other current liabilities (current maturities of long-term debts, interest, accrued but not due on borrowings, interest accrued and due on borrowings, outstanding expenses, unclaimed dividend, calls-in-advance, etc)
(d) Short-term provisions
(ii) Liquid ratio/Quick ratio/Acid test ratio This ratio establishes relationship between liquid assets and current liabilities and is used to measure the firm’s ability to pay the claims of creditors immediately. This ratio is a better indicator of liquidity and 1 : 1 is considered to be ideal.
Items Included in Liquid/Quick Assets
(i) Current investments.
(ii) Trade receivables (bill receivables, debtors less provisions for doubtful debts).
(iii) Cash and cash equivalents.
(iv) Short-term loans and advances.
(v) Other current assets except prepaid expenses.
Items excluded in liquid assets are inventories, prepaid expenses.
Items Included in Current Liabilities
(i) Short-term borrowings.
(ii) Trade payables (bills payable and sundry creditors).
(iii) Other short-term liabilities.
(iv) Short-term provisions.
2. Solvency Ratios Solvency ratios judge the long-term financial position of an enterprise i.e. whether business is able to pay its long-term liabilities or not.
(i) Debt to Equity ratio It establishes the relationship between long-term debt (external equities) and the equity (internal equities) i.e. shareholders’ funds. It is computed to ascertain soundness of the long-term financial position of the firm.
Generally, the ratio of 2 : 1 is considered as an ideal.
Items Included in Long-term Debts It includes long-term borrowings and long-term provisions.
Items Included in Equity or Shareholders’ Funds
Equity or Shareholders’ Funds = Equity Share Capital + Preference Share Capital+ Reserves and Surplus
or
*Non-current Asset (Tangible assets + Intangible assets + Non-current trade investments + Long-term loans and advances) + Working Capital – Non-current Liabilities (Long-term borrowings + Long-term provisions)
Working Capital = Current Assets – Current Liabilities
(ii) Proprietary ratio It establishes the relationship between proprietors’ funds and total assets.
Proprietors’ Funds or Shareholders’ Funds
Liabilities Approach Share Capital + Reserves and Surplus
or
Assets Approach
*Non-current Assets (Tangible assets + Intangible assets + Non-current trade
investments + Long-term loans and advances) + Working Capital – Non-current Liabilities (Long-term borrowings + Long-term provisions)
Total Assets Total assets include
» Non-current Assets [Fixed assets (Tangible and intangible assets) + Non-current Investments + Long-term Loans and Advances
» Current Assets [Current investments + Inventories (including spare parts and loose tools) + Trade Receivables + Cash and Cash Equivalents + Short-term Loans and Advances + Other Current Assets]
(iii) Total assets to debt ratio It establishes a relationship between total assets and total long-term debts.
Items Included in Total Assets
Total Assets It includes
»Non-current Assets [Fixed assets (Tangible and intangible assets) + Non-current Investments + Long-term Loans and Advances
»Current Assets [Current investments + Inventories (including spare parts and loose tools) + Trade Receivables + Cash and Cash Equivalents + Short-term Loans and Advances + Other Current Assets]
Items Included in Long-term Debts
(a) Long-term borrowings
(b) Long-term provisions
(iv) Interest coverage ratio This ratio expresses the relationship between net profit before interest and tax and interest payable on long-term debts. The ideal coverage ratio is 6 to 7 times.
3. Turnover or Performance or Activity Ratios These ratios measure how efficiently a company is using its assets to generate sales.
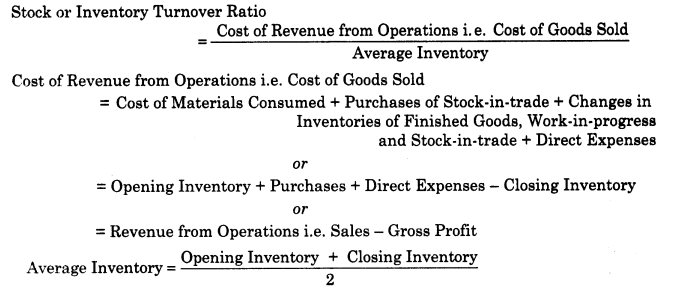
(i) Stock turnover ratio or Inventory turnover ratio The ratio indicates the number of times the stock is turned in sales during the accounting period, i.e. it measures how fast the stock is moving through the firm and generating sales.
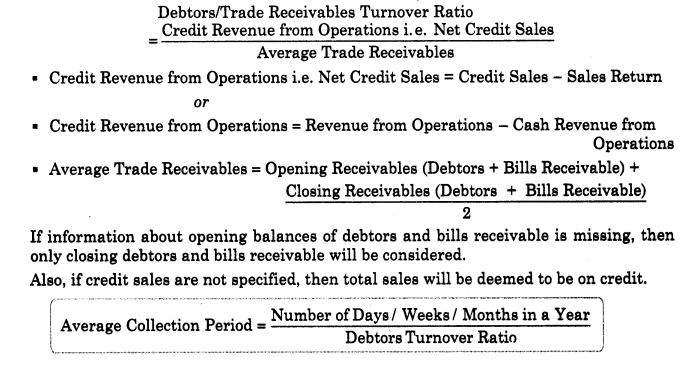
(ii) Trade Receivables or Debtors turnover ratio It indicates economy and efficiency in the collection of amount due from debtors.
(iii) Trade payables or Creditors turnover ratio It indicates the speed with which the amount is being paid to creditors. The higher the ratio, the better it is.
In the absence of opening creditors and bills payable, closing creditors and bills payable can be used in the above formula. Also, if credit purchases are not given, then all purchases are deemed to be on credit.
(iv) Working capital turnover ratio This ratio shows the number of times the working capital has been rotated in generating sales.
4. Profitability Ratios These ratios measure the profitability of a business assessing the and helps in overall efficiency of the business.
(i) Gross profit ratio Gross profit ratio shows the relationship between the net sales gross profit to net sales (revenue from operations)
In case, statement of profit and loss is given, cost of revenue from operations i.e. cost of goods sold is computed by adding cost of materials consumed, purchases of stock-in-trade, changes in inventories of finished goods, work-in-progress and stock-in-trade and direct expenses.
(ii) Net profit ratio Net profit ratio shows the relationship between net profit and revenue from operations i.e. net sales. Net profit ratio is an indicator of overall operational efficiency of the business.
(iii) Operating ratio Operating ratio establishes the relationship between operating cost and revenue from operations i.e. net sales.
Cost of Goods Sold = Cost of Materials Consumed + Purchases of Stock-in-trade + Change in Inventories of Finished Goods, Work-in-progress and Stock in-trade + Direct Expenses
or
Revenue from Operations – Gross Profit.
Operating Expenses = Employees Benefits Expenses + Other Expenses (Other than non-operating expenses) + Depreciation and Amortisation Expenses
or
Office expenses, administrative expenses, selling and distribution expenses, employees benefit expenses, depreciation and amortisation expenses.
Alternatively operating cost may be calculated as follows:
Operating Cost = Cost of Materials Consumed + Purchases of Stock-in-trade + Change in Inventories of Finished Goods, Work-in-progress and Stock-in-trade + Employees Benefits Expenses + Other Expenses (Other than non-operating expenses)
(iv) Operating profit ratio Operating profit ratio establishes the relationship between the operating profit and i.e. (revenue from operations) net sales. Operating profit ratio is an indicator of operational efficiency of the business.
(v) Return on investment/Capital employed It establishes the relationship between net profit before interest, tax and preference dividend and capital employed (equity + debts).
Capital employed can be calculated from liabilities side approach and assets side approach as follows:
When Liabilities Approach is Followed It is computed by adding
(a) Shareholders’ funds (i.e. share capital, reserves and surplus).
(b) Non-current liabilities (i.e. long-term borrowings and long-term provisions).
When Assets Approach is Followed It is computed by adding
(i) Non-current assets, i.e.
(a) Fixed assets (tangible fixed assets, intangible fixed assets).
(b) Non-current trade investments.
(c) Long-term loans and advances.
(ii) Working capital, i.e. current assets – current liabilities.
NOTE Since,non-operating assets are excluded while determining capital employed, income from non-operating assets should also be excluded from profit.


Leave a Reply