Graphs of Linear Equations (रैखिक समीकरणों के रेखांकन) In Hindi
Graphs of Linear Equations (रैखिक समीकरणों के रेखांकन) :- रैखिक समीकरणों के रेखांकन का अर्थ है किसी रैखिक समीकरण को एक रैखिक गणितीय अभिव्यक्ति में परिवर्तित करना, ताकि उसका सामान्य रूप में समाधान किया जा सके। यह तकनीक रैखिक समीकरणों को आसानी से हल करने के लिए प्रयोग की जाती है।
उदाहरण के लिए,
3x+6y = 3 और -x+5y = 2 दो चर वाले रैखिक समीकरण हैं।
Graphs of Linear Equations In English
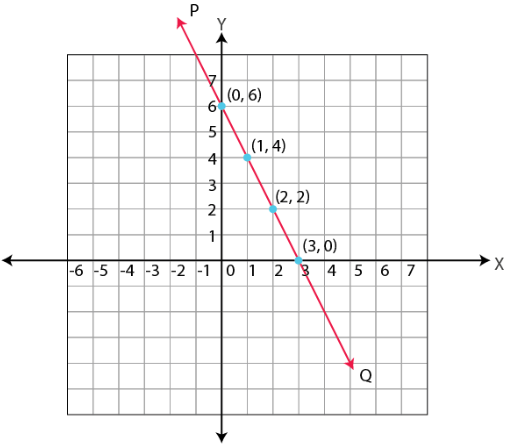
Graphs of Linear Equations :- Graphs of linear equations represent straight lines on a coordinate plane. Each linear equation can be represented graphically by plotting points that satisfy the equation and then connecting those points with a straight line.
Example: 2x+y =12 and 5x-2y = 3
2x+y =12
y=12-2x ……(i)
5x-2y = 3
Put Value of y from (i)
5x-2(12-2x) =3
5x-24+4x =3
9x=27
x=3
Now,
put value of x in (i) equation
y=12-2x
y= 12-2x(3)
y= 6


Leave a Reply