Pie Chart (वृत्त आरेख) In Hindi
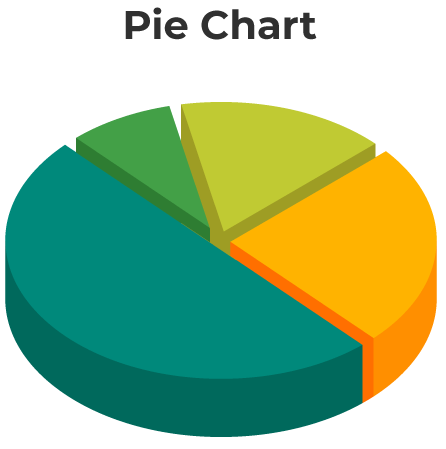
पाई चार्ट को हिंदी में वृत्त आरेख या पाई आलेख भी कहा जाता है. यह एक गोलाकार आकार का ग्राफ होता है जिसे विभिन्न भागों में विभाजित किया जाता है। हर भाग किसी डेटा श्रेणी (जैसे – खर्च करने की विभिन्न मदों का प्रतिशत) को दर्शाता है, और उस भाग का क्षेत्रफल पूरे वृत्त के क्षेत्रफल के अनुपात में उस श्रेणी के डेटा के मान के बराबर होता है।
सरल शब्दों में, पाई चार्ट एक तरह का केक होता है जिसे टुकड़ों में काट दिया जाता है. हर टुकड़े का आकार पूरे केक में उस चीज़ के हिस्से को दर्शाता है। पाई के सभी स्लाइस को मिलाकर पूरा 100 प्रतिशत और 360 डिग्री के बराबर बना लें।
Pie Chart In English
A pie chart is a circular graph used to visualize data. Imagine a pie cut into slices. The whole pie represents the entire dataset, and each slice represents a portion of that data. The size of the slice corresponds to the proportion it represents of the whole pie. The total value of the pie is always 100%.
Pie Chart Formula to Calculate Degrees
- To calculate the percentage of the given data, we use the formula: (Frequency ÷ Total Frequency) × 100
- To convert the data into degrees we use the formula: (Given Data ÷ Total value of Data) × 360°
Common Uses of Pie Chart
Here are some examples of how a pie chart can be used in the real world:
1. To represent growth areas in businesses, such as profit and loss, what departments/teams/activities generated the most profit during a specific time, or to identify the least growth areas.
2.To signify market trends and consumer behaviors
3. To identify/display the contribution of different marketing strategies or tools
4. To represent sales data
5. To show the performance of projects, tools, strategies, or individuals
6. To demonstrate employee behaviors
Pie Chart Advantages
1. A pie chart is a simple and easy-to-understand method to represent the data visually as a fractional part of a whole.
2. It provides an effective communication tool visually simpler than other types of graphs.
3. Pie chart helps in data comparison for the audience at a glance to give an immediate analysis or to quickly understand information due to widespread use in business and the media.
Pie Chart Disadvantages
1. A pie chart loses its effectiveness when there are too many data categories.
2. It’s only used to represent the components or categories of one data set.
3. You need more than one pie chart to compare multiple data sets.
4. Using more than one pie chart can make it difficult for an average reader to understand and analyze the data, which kills the whole purpose of using pie charts for their higher visualization value.


Leave a Reply