
Introduction
The economy of a country depends on the activities people do to earn a living. These activities are divided into three types: primary (e.g., farming, mining), secondary (e.g., manufacturing), and tertiary (e.g., services like teaching, banking). This chapter compares the economies of India, Brazil, and the USA, focusing on their national income, per capita income, and key occupations like agriculture, mining, fishing, and industries. Both India and Brazil are developing economies, while the USA is a developed economy.
Gross National Income (GNI) (1960-2016)
Graph Analysis (Fig. 8.1):
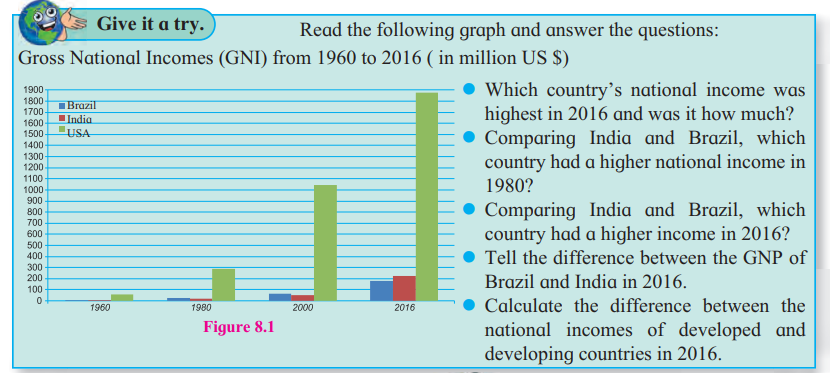
Highest GNI in 2016: The USA had the highest national income in 2016 (exact amount not specified in the text).
India vs. Brazil in 1980: Brazil had a higher national income than India in 1980.
India vs. Brazil in 2016: India had a higher national income than Brazil in 2016.
Difference in GNI (Brazil vs. India, 2016): India’s GNI was higher than Brazil’s, but the exact difference is not provided.
Developed vs. Developing Countries (2016): The USA (developed) had a much higher GNI than India and Brazil (developing). The exact difference is not given, but the USA’s advanced technology and education contribute to this gap.
Per Capita Income (1960-2016)
Definition: Per capita income is the average income per person in a country.
Comparison:
- The USA has a much higher per capita income than India and Brazil due to its advanced technology, patents, and educated population.
- Brazil has a higher per capita income than India, even though India’s total GNI is higher. This is because India’s population is much larger, so the income is divided among more people.
- Reason for India’s Low Per Capita Income: India’s massive population size reduces the per capita income.
Types of Economies
India and Brazil: Both have mixed economies (a mix of government and private ownership in various sectors).
- Primary Activities: Agriculture, mining, fishing.
- Secondary Activities: Manufacturing, industries.
- Tertiary Activities: Services like banking, education, and IT.
USA: A developed economy with a focus on tertiary and quaternary (knowledge-based) activities.
Ownership of Sectors
A table (not provided in the text) compares the ownership of sectors in India and Brazil. Both countries have:
- Public Sector: Government-owned (e.g., railways, some banks).
- Private Sector: Owned by individuals or companies (e.g., private industries, IT firms).
Inference: The mix of public and private ownership shows that both are developing mixed economies.
Contribution of Sectors to GDP and Population Engagement (2016) (Fig. 8.2)
Pie Charts Analysis:
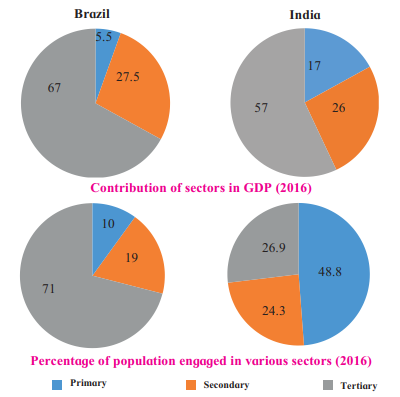
Primary Activities:
- Brazil: 5.5% of GDP, 10% of population engaged.
- India: 17% of GDP, 48.8% of population engaged.
- Observation: India has a higher percentage of population engaged in primary activities (e.g., agriculture).
Secondary Activities:
- Brazil: 27.5% of GDP, 19% of population engaged.
- India: 26% of GDP, 24.3% of population engaged.
- Observation: Brazil has a slightly higher share of secondary activities in GDP.
Tertiary Activities:
- Brazil: 67% of GDP, 71% of population engaged.
- India: 57% of GDP, 26% of population engaged.
- Observation: Brazil has a greater contribution of the tertiary sector to GDP and more people engaged in services.
Is Brazil an Agrarian Economy Like India?
- No, Brazil is not primarily an agrarian economy like India.
- Reasons:
- Brazil’s tertiary sector (services) contributes the most to GDP (67%).
- Only 10% of Brazil’s population is engaged in agriculture, compared to 48.8% in India.
- Brazil is a global leader in mining, manufacturing, and services, unlike India, which still relies heavily on agriculture.
Agriculture
Brazil
Main Occupation: Agriculture is key in the highlands and coastal areas due to favorable climate and topography.
Crops:
- Cereal Crops: Rice, maize (concentrated in the central part).
- Commercial Crops: Coffee (largest exporter, grown in Minas Gerais and Sao Paulo), cocoa, rubber, soybean, sugarcane.
- Fruits: Bananas, pineapples, oranges, citrus fruits.
Animal Rearing: Cattle, sheep, and goats in the Savannah grasslands (south) for meat and dairy production.
India
Contribution: Agriculture contributes significantly to GDP (17%) and employs 48.8% of the population.
Features:
- 60% of land is under cultivation due to level plains, rich soils, and a long growing season.
- Subsistence Agriculture: Most farmers grow crops for their own use.
Crops:
- Food Crops: Rice, wheat, maize, sorghum, millets.
- Cash Crops: Sugarcane, cotton, jute, tea, coffee, rubber.
- Fruits and Vegetables: A variety of fruits and vegetables are produced.
Map Activity: Show the distribution of crops like wheat, jowar, rice, cotton, sugarcane, tea, and apples on an outline map of India using symbols.
Fishing
Brazil
Coastline: 7,400 km with excellent fishing grounds in the South Atlantic.
Why Fishing is Concentrated in the Southeast?
- The meeting of the warm Brazil Current and cold Falkland Current creates a rich fishing ground.
- Proximity to ports and markets.
Types of Fish: Swordfish, shrimp, lobsters, sardines.
Inland Fishing: Not developed despite many rivers because:
- The Amazon River fish resources are underutilized.
- Fishing is done on a small scale with primitive techniques.
Ocean Currents:
- Warm: Brazil Current.
- Cold: Falkland Current.
India
Importance: India is a major producer of fish (marine and inland), contributing to food supply, employment, and foreign exchange.
Coastline: 7,500 km.
Marine Fishing (40% of production):
- Concentrated in Kerala, West Bengal, Odisha, Andhra Pradesh, Tamil Nadu, Goa, Maharashtra.
- Fish: Sardines, mackerel, Bombay duck, prawns, horse mackerels, clupeids, silver bellies.
Inland Fishing (60% of production):
- Done in rivers, canals, ponds, lakes, etc.
- Fish: Silver bellies, carp (chopda).
Pisciculture: Fish farming is growing in India. Students should research this using the internet or books.
Mining
Brazil
Regions: Eastern Brazil is rich in minerals like iron ore, manganese, nickel, copper, bauxite, tungsten, diamonds.
Why Mining is Limited in Western Brazil?
- Inaccessibility, dense forests, and lack of knowledge about mineral reserves.
Development: Mining is well-developed in the highland region due to increasing demand.
Map Activity: Prepare a table of mining products and their regions in Brazil.
India
Main Region: Chhota Nagpur Plateau is a major source of minerals.
Minerals:
- Coal: Korba (Chhattisgarh), eastern Maharashtra.
- Oil and Gas: Digboi (Assam), Mumbai High (Arabian Sea), Kalol, Koyali (Gujarat), Godavari River mouth.
- Stones: Marble (Rajasthan), Cuddapah (Andhra Pradesh).
Industries
Brazil
Major Industries:
- Iron and steel, automobile assembly, petroleum processing, chemicals, cement, food processing (sugar), textiles (cotton, silk, wool).
- Technology-Based Industries: Growing but not dominant.
Location: Most industries are in the south and southeast. The northeast is poorer but attracting new investments.
India
Distribution: Uneven due to the availability of raw materials and power.
********************—————******************-
- Metallurgical: In Jharkhand, Odisha, Chhattisgarh, Madhya Pradesh, Rajasthan, Karnataka, Tamil Nadu (steel, aluminum, copper, zinc).
- Agro-Based: Cotton, jute, sugar in raw material-producing areas.
- Forest-Based: Paper, plywood, matches in forest areas.
- Coastal: Coir, copra, fish canning in Kerala.
- Petroleum: Refineries in Koyali, Digboi, Noonmati, Bongaigaon (near oil fields) and Mathura, Barauni (inland).
- Salt: Produced in Gujarat, Rajasthan, Tamil Nadu.
- Consumer Industries: Mechanical engineering, electricals, automobiles, fertilizers near big cities.
Map Activity: Identify industries from logos (Fig. 8.4), their raw materials, and regions.
Trade
Brazil
- Exports: Iron ore, coffee, cocoa, cotton, sugar, tobacco, oranges, bananas.
- Imports: Machinery, chemicals, fertilizers, wheat, heavy vehicles, mineral oil, lubricants.
- Trading Partners: Germany, USA, Canada, Italy, Argentina, Saudi Arabia.
- Balance of Trade: Exports exceed imports in all years (favorable balance).
India
- Exports: Tea, mangoes, coffee, spices, leather goods, iron ore, cotton, silk textiles.
- Imports: Petroleum, machines, pearls, precious stones, gold, silver, paper, medicines.
- Trading Partners: UK, USA, Germany, Japan, China, Russia.
- Balance of Trade: Not specified, but trade makes up 25% of GDP.
- Salt Production in Rajasthan: Despite no coastline, Rajasthan produces salt from inland salt lakes (e.g., Sambhar Lake).
India-Brazil Trade (Fig. 8.6)
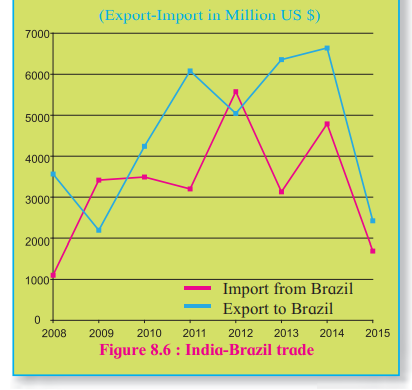
Key Points:
- Exports to Brazil exceeded imports in some years (exact years not specified).
- The most favorable trade year is not clear from the text.
- Balance of Trade (2013): Needs graph analysis (not provided).
Investments:
- Indian companies invest in Brazil’s IT, pharmaceuticals, energy, agribusiness, mining, and auto sectors.
- Brazilian companies invest in India’s automobiles, IT, mining, energy, biofuels, and footwear sectors.
BRICS
- Full Form: Brazil, Russia, India, China, South Africa.
- Established: 2006.
- Objectives: Promote economic cooperation, trade, and development among member countries.
- Non-Member Continents: Australia, North America, Antarctica.
- Member Continents: South America (Brazil), Europe/Asia (Russia), Asia (India, China), Africa (South Africa).
Currency
- USA: US Dollar ($).
- Brazil: Brazilian Real (R$) (1 USD = 3.1297 BRL).
- India: Indian Rupee (₹) (1 USD = 64.153 INR).
- Note: Currency rates change frequently.
Taxation
- India: Goods and Services Tax (GST) introduced for uniform taxation across the country.
- Brazil: GST system in place since 1984 with multiple tax slabs.
Map Activities
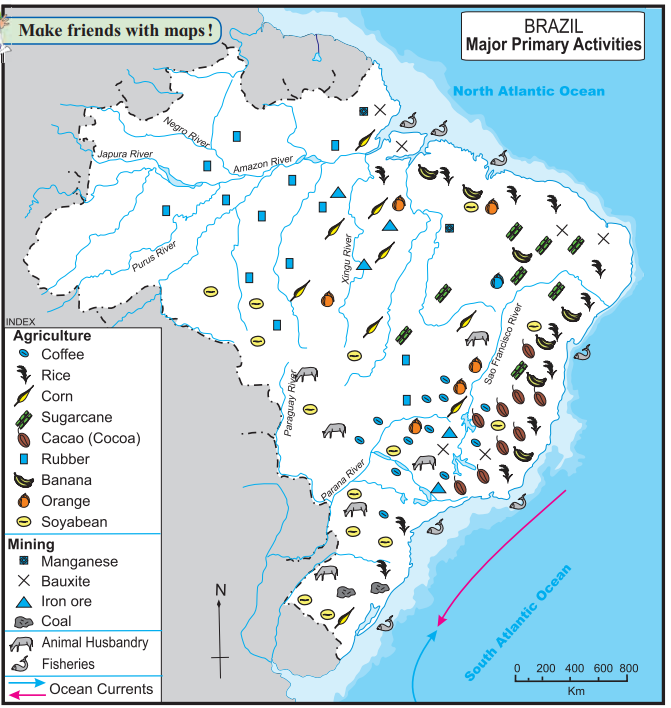
Brazil (Fig. 8.3):
- Coffee: Produced in Minas Gerais and Sao Paulo (southeast).
- Food Crops: Rice, maize in the central part.
- Climate Relation: Warm and humid climate supports coffee and sugarcane; savannah climate supports maize.
- Rubber Plantations: Concentrated in the Amazon region.
Mining Table:
| Mineral | Region |
|---|---|
| Iron Ore | Eastern Brazil |
| Manganese | Eastern Brazil |
| Bauxite | Eastern Brazil |
| Diamonds | Eastern Brazil |
India:
- Show the distribution of wheat (north), jowar (central), rice (east, south), cotton (west), sugarcane (north, south), tea (northeast), and apples (north) on a map.
Leave a Reply